F1 Forecast Lab
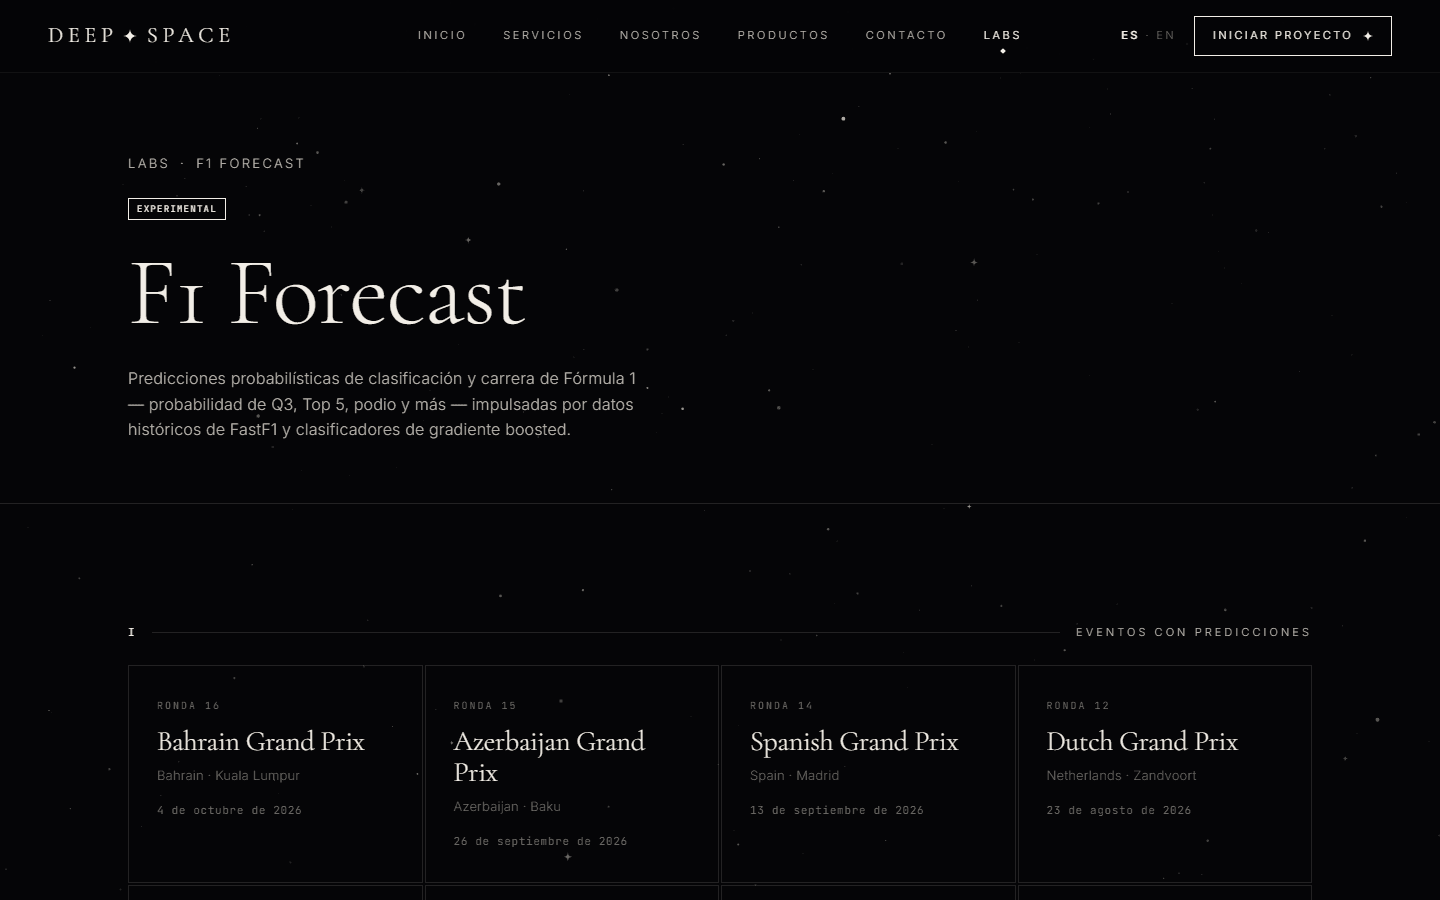
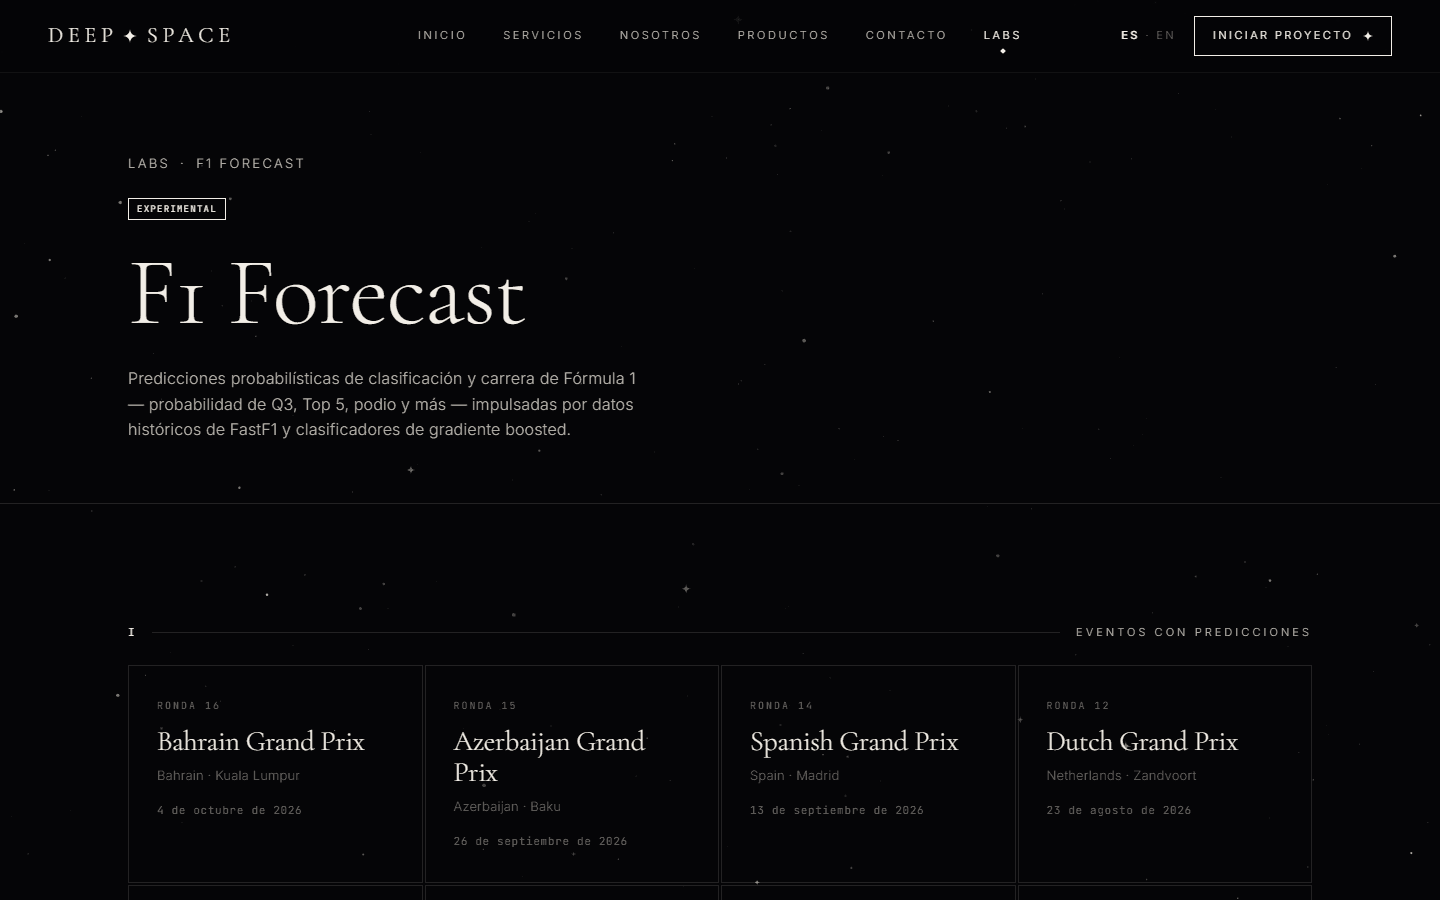
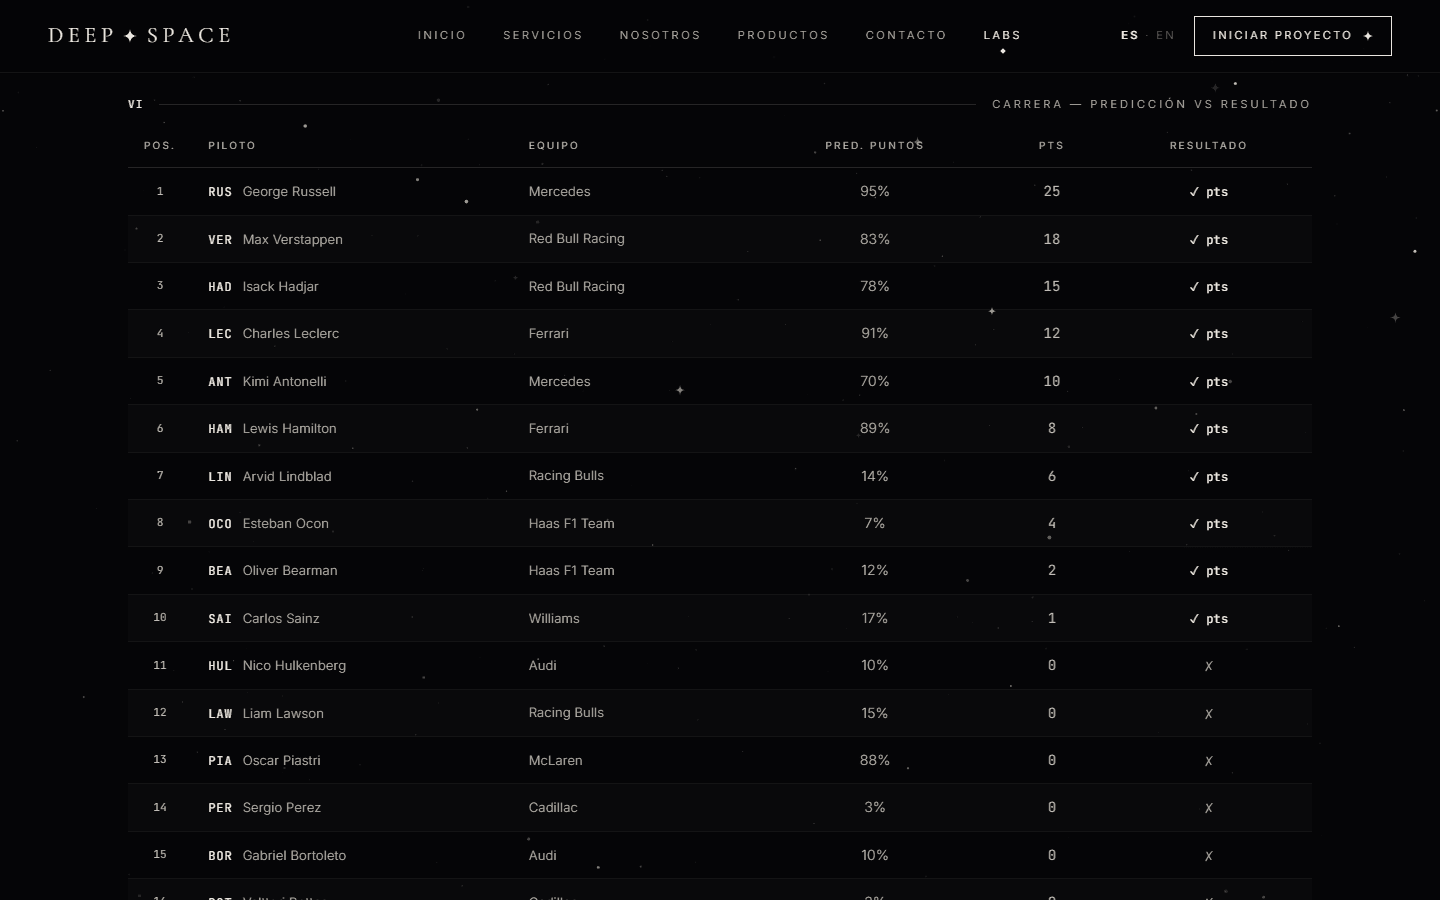
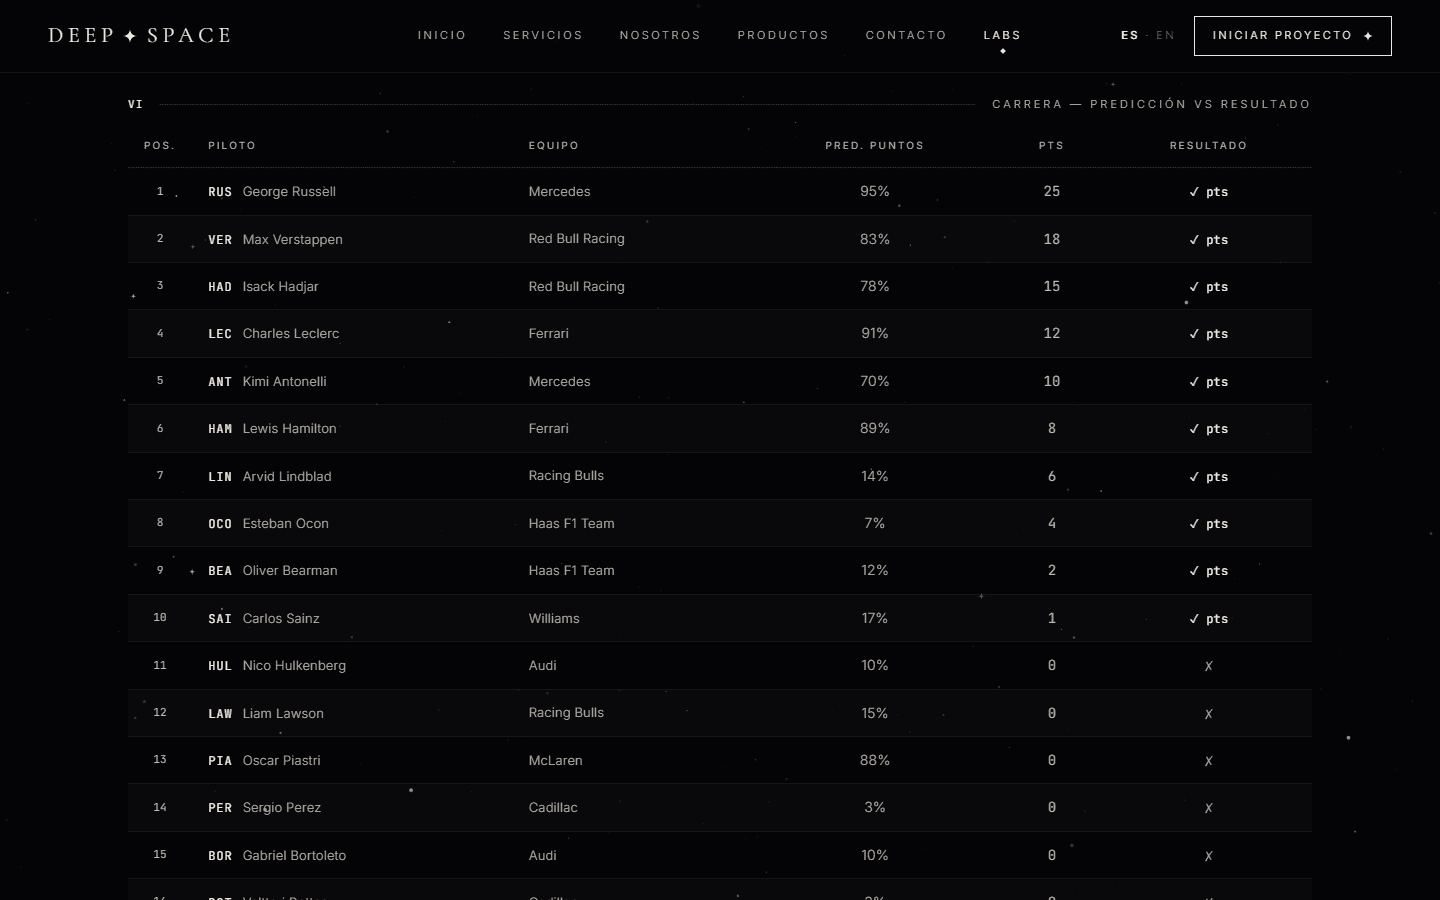
An ML pipeline that forecasts Formula 1 qualifying and race results, with a dashboard that compares predictions to what happened.
Problem
A forecasting model that sees data from after the event looks brilliant in testing and fails on race day. F1 Forecast Lab is a pipeline built to test its predictions honestly.
My role
I was the main developer of F1 Forecast Lab, a DeepSpace project.
Approach
- Data. A Python monorepo managed with
uvingests session data with FastF1, with leakage checks that keep future information out of training. - Models. Logistic regression, LightGBM and XGBoost, with calibration, compared on backtests at both event and season level.
- Operations. The
f1-weekendoperator CLI drives each run, and results sync to Supabase. - Dashboard. A Next.js dashboard shows predicted against actual results.
Outcome
Live, with the qualifying and race models done.
I compared logistic regression, LightGBM and XGBoost on 11 five-event windows, rolling from the 2023 season. Logistic regression and XGBoost rank drivers about equally well, but XGBoost's probabilities are closer to what happened: it has the lower Brier score on 5 of the 6 targets. XGBoost is the model in production for both qualifying and the race.
| Target | XGBoost ROC AUC | Logistic ROC AUC | XGBoost Brier | Logistic Brier |
|---|---|---|---|---|
| Reaches Q3 | 0.880 | 0.878 | 0.143 | 0.142 |
| Qualifies top 5 | 0.910 | 0.912 | 0.097 | 0.110 |
| Qualifies top 3 | 0.908 | 0.907 | 0.083 | 0.110 |
| Finishes in the points | 0.854 | 0.850 | 0.154 | 0.158 |
| Finishes top 5 | 0.932 | 0.930 | 0.084 | 0.095 |
| Podium | 0.927 | 0.929 | 0.075 | 0.097 |